


HALF-FULL REPORT 11/25/16
A Tale of Trump in Two Charts.
The first is Low Priced Stocks vs. the S&P 500 over the last 22 years. The first shaded section is the early 2000s dotcom crash, the second is the Lehman 2008 collapse. But the key data point here is the fork-in-the-road divergence starting in early 2013, with the S&P rocketing up and the low caps racing for the basement.
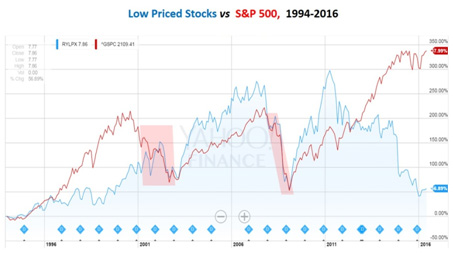 What happened? The SEC launched its enforcement of Dodd-Frank, particularly its making stock brokers and investment advisors criminally liable for recommending high-risk shares to clients. The obvious consequence is that brokers abandoned any high-risk/low-priced company.
The second chart is that of the Russell 2000 (the bottom 2000 stocks in the Russell 3000) since Trump’s election. It closed last night (11/23) at 1342.09, a record high with a win streak of 14 consecutive sessions, the longest in over 20 years.
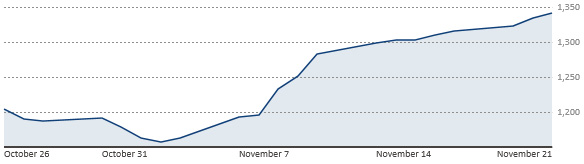 What’s the connection? Trump has pledged to repeal Dodd-Frank.
There’s so much more – this Thanksgiving HFR is going to be one of the most enjoyable you’ve ever read. I guarantee it….